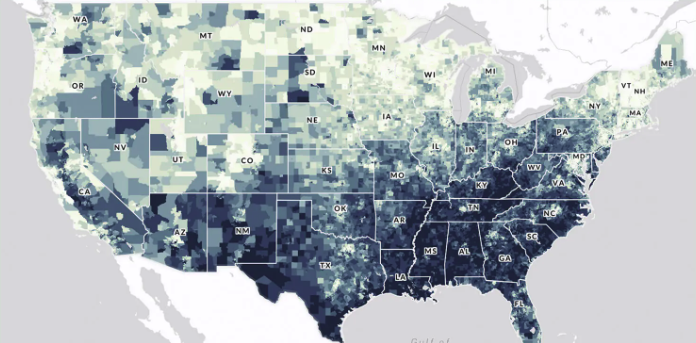
The U.S. Climate Vulnerability Index map is an interactive tool that ranks more than 70,000 U.S. census tracts using 184 indicators to show which communities face the greatest challenges from climate change. It visualizes “overall climate vulnerability” as well as underlying drivers in domains such as health, social and economic conditions, environment, infrastructure, and climate impacts (e.g., extreme events and climate disaster costs). Users can search for any location, compare tracts within a state or EPA region, and drill down to see which specific factors—like housing quality, exposure to pollution, or health burdens—are contributing to vulnerability, helping communities and decision‑makers target climate resilience investments where they are needed most.
Air quality maps, trends viewer, a downloadable tool and lab data. From the website: "AQview is a community-focused air quality data portal bringing together government and community-led air monitoring data to a single platform. Our primary goal is make it easier to access, understand, and use air quality data collected from the wide range of monitoring efforts occurring across California."
Atmospheric Composition Analysis Group applies satellite observations, global models, and in situ measurements to improve understanding about the processes controlling air quality, climate, and biogeochemical cycling
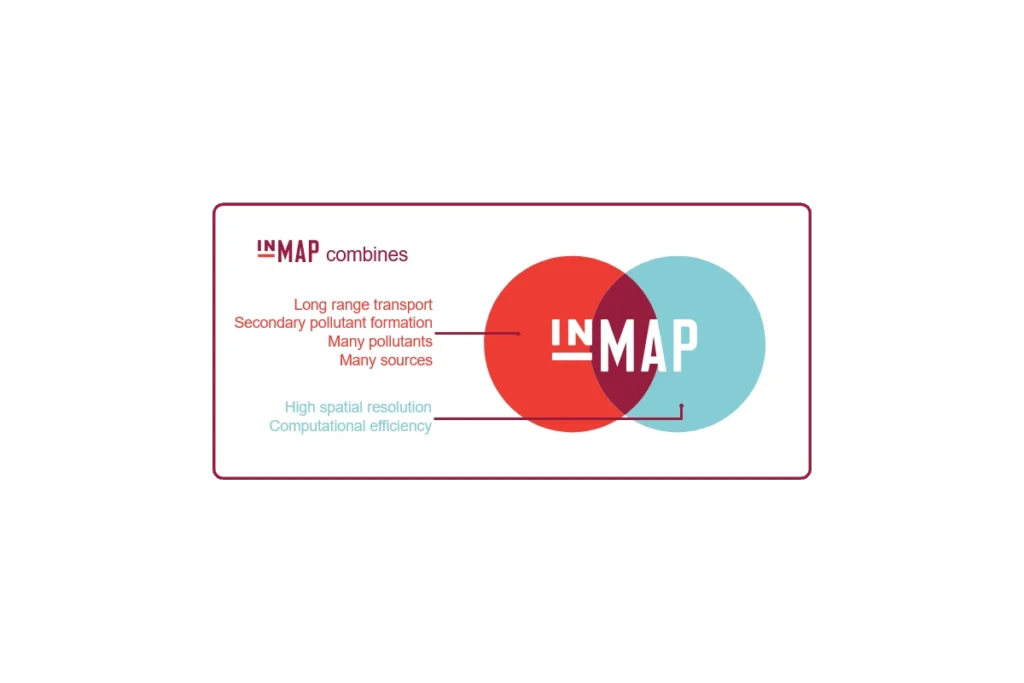
InMAP is a recently developed model which offers a new approach to estimating the human health impacts caused by air pollutant emissions and how those impacts are distributed among different groups of people.
The EDF Turbine Map is an advocacy-focused geospatial tool developed by the Environmental Defense Fund (EDF) in partnership with Moms Clean Air Force and EcoMadres. It is designed to expose the environmental and health impacts of gas-fired combustion turbines across the United States.
Mapping tool that provides information on criteria pollutant and GHG emissions from Title V permitted sources in New Mexico. Data is provided in map form or in tables and charts. Data can be filtered and downloaded as a CSV file.
CASTNET is a national monitoring network established to assess trends in pollutant concentrations, atmospheric deposition, and ecological effects due to changes in air pollutant emissions.
Subscribe
Sign up to get the latest updates on new city clean air tools and resources.