Investigate the problem icon
Step 1: Investigate the problem

Air pollution and health in your city

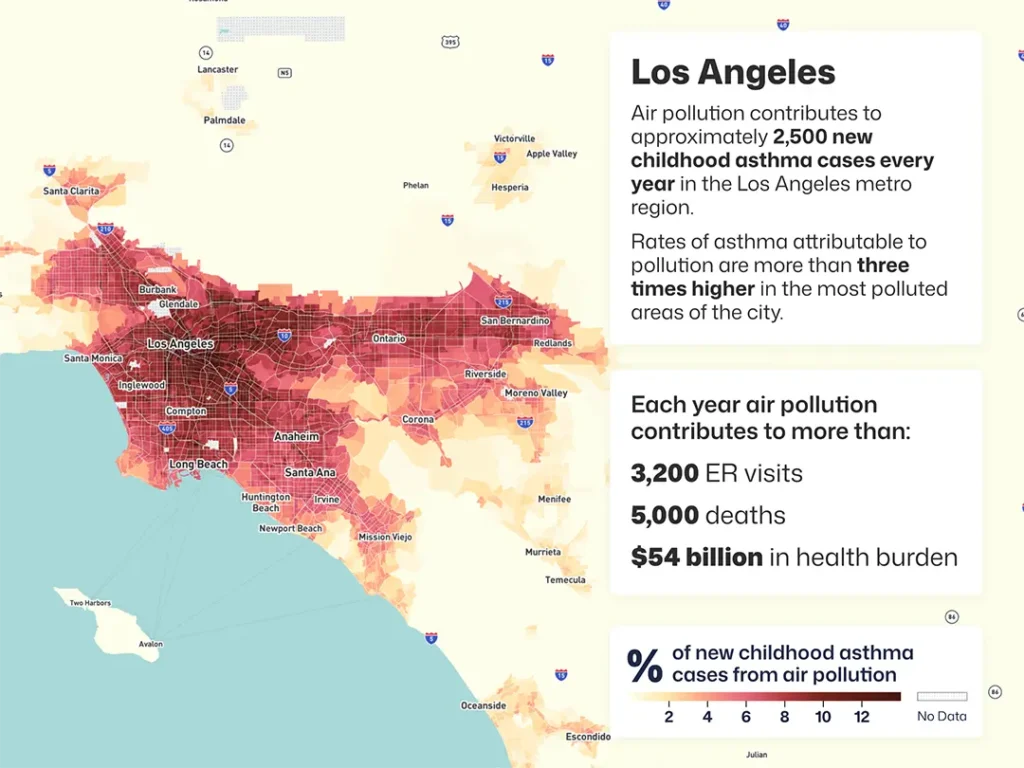
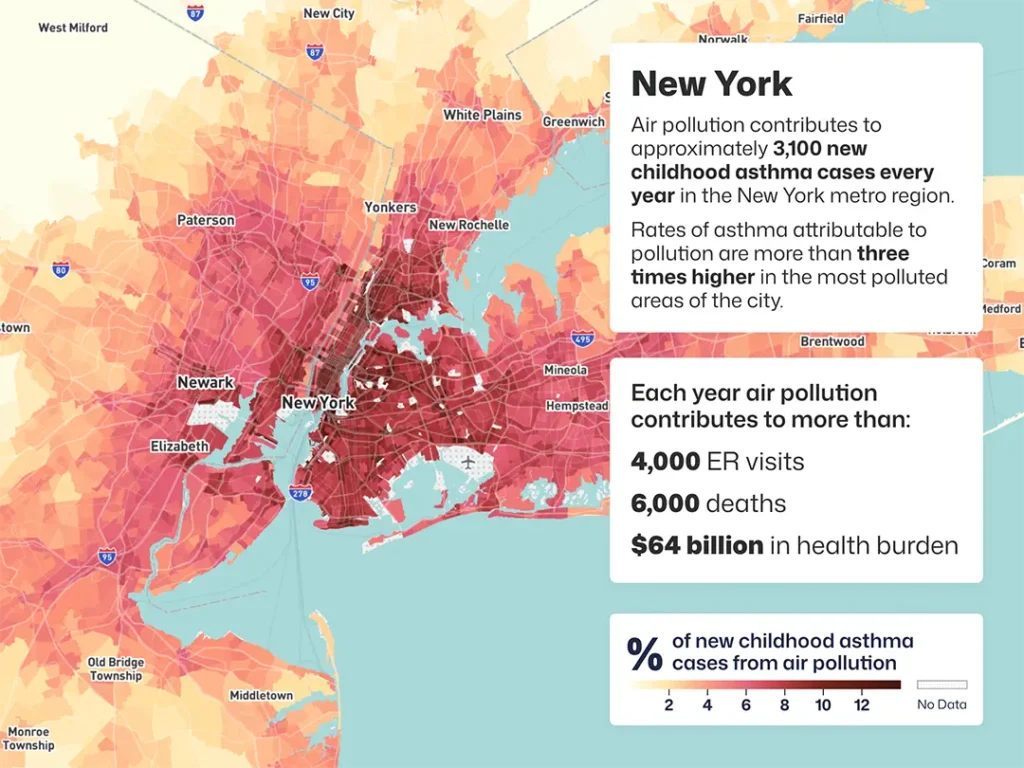
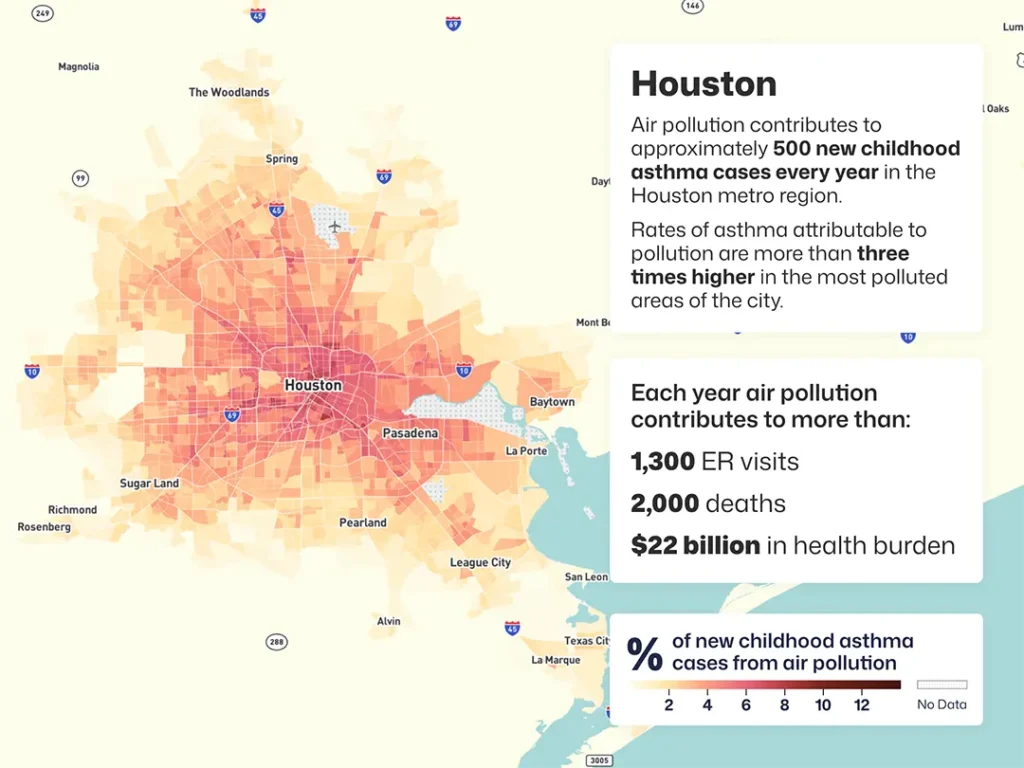
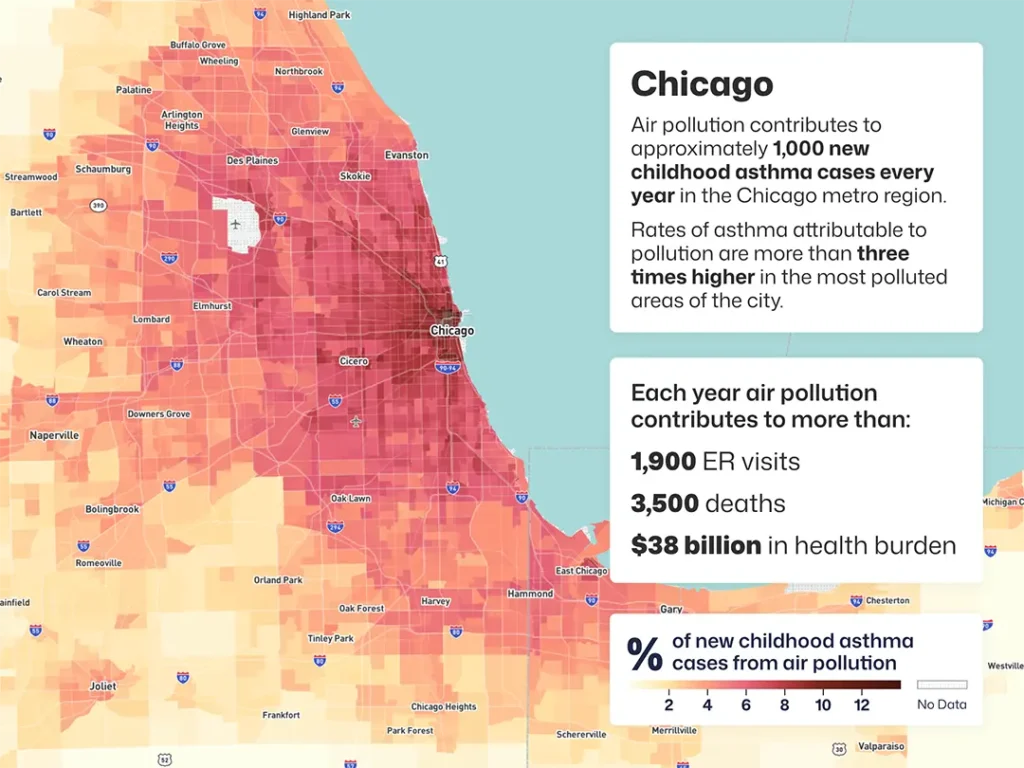
Across the United States, air pollution contributes to more than 15,000 new child asthma cases, 50,000 emergency room visits and 100,000 deaths every year. It carries enormous economic costs, too — more than $1 trillion every year or 5% of GDP. The health and economic effects of pollution vary across cities depending on factors like location, local pollution sources, weather, demographic patterns and state and local policies.

Air pollution’s health harms fall harder on some groups than others. Children, seniors and pregnant women are among the most vulnerable, as well as lower-income and black and brown communities. One study found air pollution-linked childhood asthma cases were 7.5 times higher for U.S. communities of color than for mostly white communities. Focusing policies on most affected groups is crucial to correcting a legacy of unfair treatment and maximizing health benefits. 

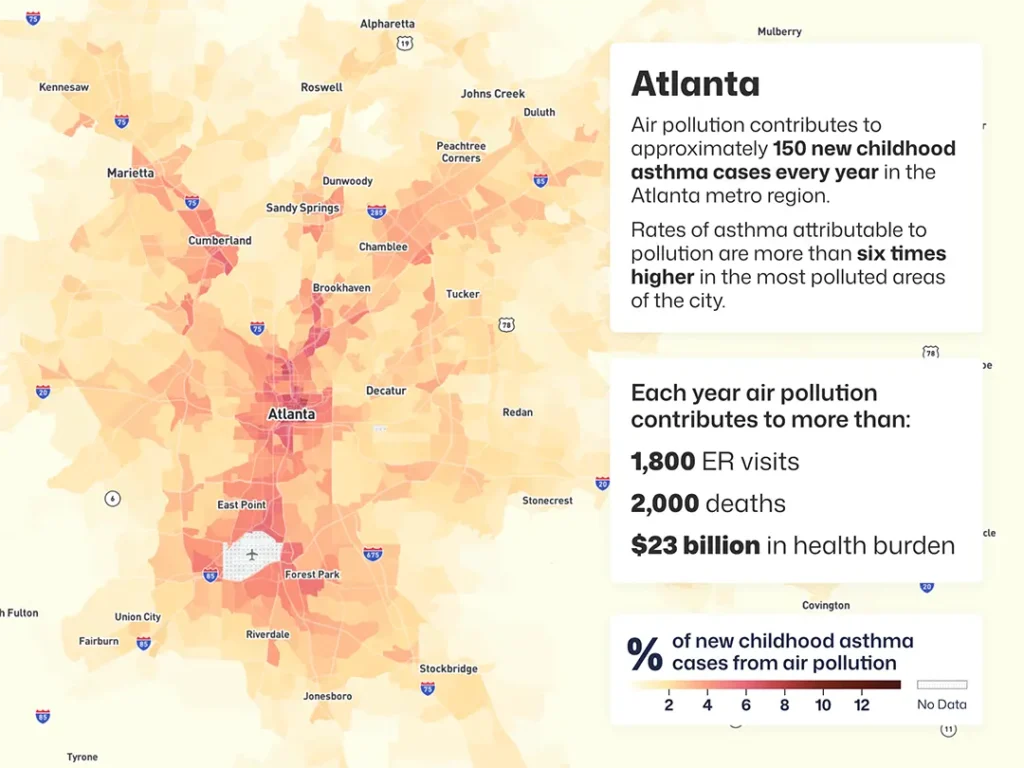
While the impacts of air pollution are distributed differently in every city, understanding who is most affected and how is key to raising local awareness and making a strong case for policy action.

Annual economic costs of air pollution in the United States

More than
$ 0 trillion

See how air pollution’s health impacts vary between and within cities

Enter your location below to learn more about air pollution’s health impacts in your city

This tool can help your city get a clearer picture of where the health and economic burdens of air pollution fall. Use it to generate a city-specific report on local harms, including childhood asthma cases, emergency room visits and early deaths.   

For more on the methodology behind these maps and statistics, click here.

Air pollution and health information

  • Filters

    Reset filters
  • Geographic Coverage

  • Sector

  • Pollutants

  • Resource Type

  • Format

  • Cost

  • Owner

  • Data Type

Evaluation Policy

Evaluating Climate and Health

The Climate and Health Program uses CDC's Evaluation Framework to monitor and evaluate the effectiveness of climate and health work. To highlight the evaluation planning process...
Map Model

InMAP

InMAP is a recently developed model which offers a new approach to estimating the human health impacts caused by air pollutant emissions and how those impacts...
Database Evaluation

National Environmental Health Tracking Network

"The National Environmental Public Health Tracking Network (Tracking Network) brings together health data and environmental data from national, state, and city sources and provides supporting information...
Washington DC air pollution heatmap
Nitrogen dioxide pollution contributes to approximately 3,500 new childhood asthma cases every year in the Washington D.C. metro region.
New York City air pollution heatmap
Nitrogen dioxide pollution contributes to approximately 21,000 new childhood asthma cases every year in the New York metro region.
Philadelphia air pollution heatmap
Nitrogen dioxide pollution contributes to approximately 4,000 new childhood asthma cases every year in the Philadelphia metro region.
Chicago air pollution heatmap
Nitrogen dioxide pollution contributes to more than 10,000 new childhood asthma cases every year in the Chicago metro region.
Boston air pollution heatmap
Nitrogen dioxide pollution contributes to approximately 2,700 new childhood asthma cases every year in the Boston metro region.
Austin air pollution heatmap
Nitrogen dioxide pollution contributes to more than 1,800 new childhood asthma cases every year in the Austin metro region.
Baltimore air pollution heatmap
Nitrogen dioxide pollution contributes to more than 1,300 new childhood asthma cases every year in Baltimore metro region.

Sign up to get the latest updates on new city clean air tools and resources.