This is the text of the Linn County Iowa air quality ordinances. It provides extensive language on control of air pollution sources through rules and permits.
This resource provides information about the Property Assessed Clean Energy program which can be used to finance upfront costs for qualified energy, water, resilience, and public benefit projects with funding through a voluntary assessment on the property tax bill.
Toolkit providing access to information and resources about evolving loan funds, which are an internal capital pool that is dedicated to funding energy reduction or onsite generation projects that generate cost savings. A portion of those savings are then used to replenish the fund (i.e. revolved) allowing for reinvestment in future projects of similar value.
The Chicago Department of Public Health (CDPH) analyzed community-level data on air quality, health, and social factors to identify neighborhoods that should be prioritized for efforts to mitigate and reduce air pollution to better protect public health. The report builds on the commitment to health and racial equity through Healthy Chicago 2025 and initiatives led by local environmental justice organizations. The aim is to provide a resource for future action on environmental health. In developing this report, they consulted with subject matter experts, advocacy groups, and community-based environmental justice organizations.
Website providing access to tools and resources related to Best Available Control Technologies to reduce emissions of criteria pollutants and air toxics.
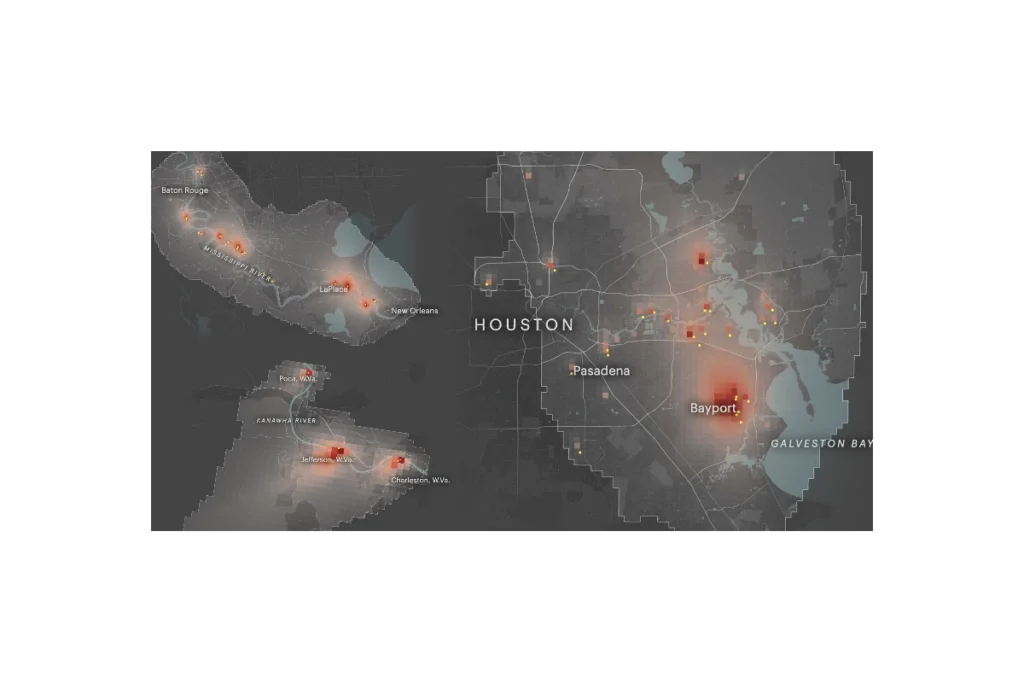
ProPublica’s Toxmap is an interactive map that visualizes estimated cancer risk from industrial air pollution across the United States. Built from EPA emissions and modeling data, it shows how toxic chemicals from thousands of facilities spread into surrounding neighborhoods, highlighting hotspots where cumulative industrial air pollution may raise cancer risk to levels the government considers unacceptable. The site lets users zoom to specific communities, see which facilities are driving risk, and explore patterns of environmental injustice in overburdened areas.
The Fuel Alternatives and Options guide, provided by the Indiana Department of Environmental Management (IDEM) through its DieselWise Indiana program, is a strategic resource for mayors looking to modernize municipal fleets and reduce the “diesel signature” in their cities.
Specifically, this webpage serves as a technical guide for city planners and fleet managers. It outlines the primary substitutes for traditional petroleum diesel, including Biodiesel, Compressed Natural Gas (CNG), Liquefied Natural Gas (LNG), Propane (LPG), Electricity, and Hydrogen. For each fuel type, the resource provides a breakdown of its chemical properties, compatibility with existing engines, environmental benefits, and the infrastructure required to support its adoption.
The C40 Communication Toolkit for Air Quality is a product of the best practices shared and lessons learned by these cities and is designed to help cities develop clear messaging, harness the power of visuals, and leverage digital communication channels to inspire collective action to improve air quality.
The CDC PLACES (Local Data for Better Health) tool is a free, interactive web resource that provides model-based estimates of chronic disease, health behaviors, preventive practices, disabilities, and related social factors for small geographic areas across the United States. It offers consistent data for all counties, most cities and towns (places), census tracts, and ZIP Code Tabulation Areas, allowing users to view, map, and download neighborhood-level health information to identify local health problems, disparities, and needs and to guide targeted public health planning and policy.
Subscribe
Sign up to get the latest updates on new city clean air tools and resources.