Provides guidance for emissions estimation and downloadable spreadsheet based tools for estimating emissions from several different source categories including asphalt plants, concrete plants, combustion sources, and woodworking facilities.
Report describing a methodology for designing and implementing assessments of interventions to improve air quality. Includes an analysis of case studies, identification of needs, and recommendations for conducting an assessment.
Example of an ordinance regulating the construction and expansion of facilities that create air pollution. Provides information on the process, requirements and regulations, and zoning requirements.
This is the text of the Linn County Iowa air quality ordinances. It provides extensive language on control of air pollution sources through rules and permits.
Toolkit providing access to information and resources about evolving loan funds, which are an internal capital pool that is dedicated to funding energy reduction or onsite generation projects that generate cost savings. A portion of those savings are then used to replenish the fund (i.e. revolved) allowing for reinvestment in future projects of similar value.
Website providing information on reduction techniques for SO2, NOx, PM, VOC, HM and POP coming from different anthropogenic sources through:
Updated information on best available techniques to reduce emissions, with a focus on technical descriptions and environmental performances, Information on the latest developments on reduction techniques both for general and specific applications, with a focus on technical descriptions and environmental performances, Operating experience and feedback from operators, with a focus on lessons learned in the field and real-life investments and operating costs.
The Chicago Department of Public Health (CDPH) analyzed community-level data on air quality, health, and social factors to identify neighborhoods that should be prioritized for efforts to mitigate and reduce air pollution to better protect public health. The report builds on the commitment to health and racial equity through Healthy Chicago 2025 and initiatives led by local environmental justice organizations. The aim is to provide a resource for future action on environmental health. In developing this report, they consulted with subject matter experts, advocacy groups, and community-based environmental justice organizations.
Website providing access to tools and resources related to Best Available Control Technologies to reduce emissions of criteria pollutants and air toxics.
The Louisiana Tumor Registry website presents information about Louisiana’s statewide, population-based cancer registry, which collects detailed data on cancer cases to support prevention, early detection, treatment, and survivorship efforts. It offers resources for cancer registrars and providers on reporting requirements, and for data users—such as public health professionals, clinicians, planners, and researchers—through statistics, interactive data visualizations, cancer maps, monographs, and one-page summaries. The site also describes the Registry’s role in national programs (SEER and CDC’s NPCR), its research infrastructure (including rapid case ascertainment), and how its high-quality data are used to guide cancer control policies and reduce cancer burden and disparities in Louisiana.
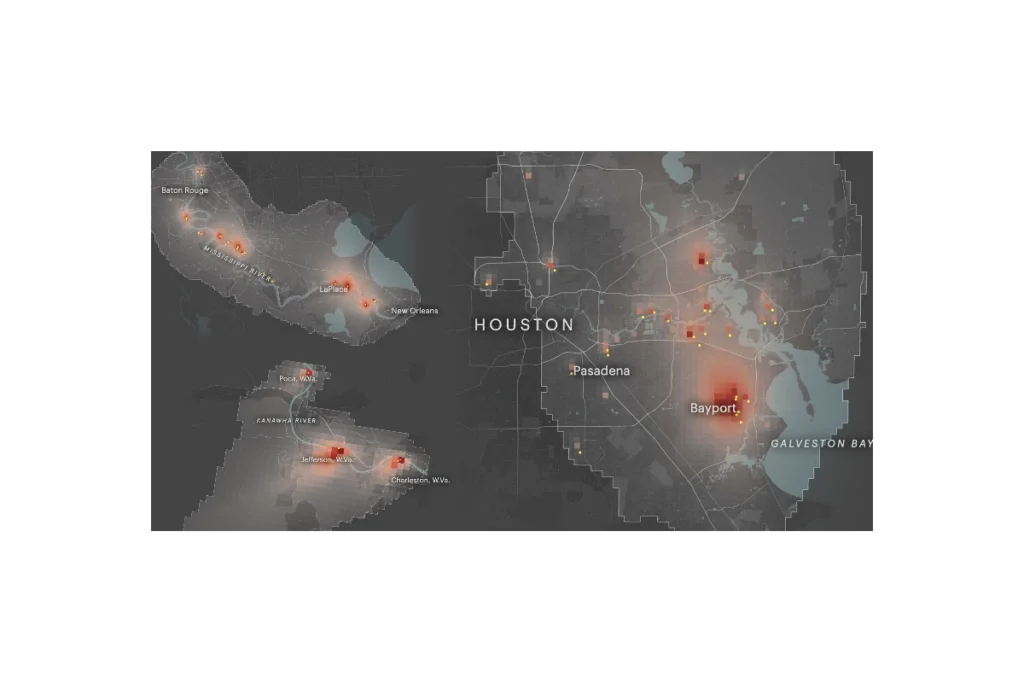
ProPublica’s Toxmap is an interactive map that visualizes estimated cancer risk from industrial air pollution across the United States. Built from EPA emissions and modeling data, it shows how toxic chemicals from thousands of facilities spread into surrounding neighborhoods, highlighting hotspots where cumulative industrial air pollution may raise cancer risk to levels the government considers unacceptable. The site lets users zoom to specific communities, see which facilities are driving risk, and explore patterns of environmental injustice in overburdened areas.
Subscribe
Sign up to get the latest updates on new city clean air tools and resources.