Website providing information on state, Tribal, and federal implementation plans. Information included on approved state regulations, source specific requirements, and nonregulatory provisions.
Report providing evidence-based guidance to inform local actions to reduce air pollution and its impacts on health. Includes interventions to address mobile sources, buildings, industrial sources, agriculture, and individual behavior.
This is a report that provides information on funding and financing approaches that are potentially applicable at state and city levels. It highlights opportunities to leverage public and private financial resources. The report was developed for EU cities, but many of the examples and cases are applicable to U.S. cities.
Case study demonstrating methods for evaluating the emissions, transportation, and health impacts of infill development (building on vacant, underutilized, or bypassed land within already developed, existing urban or suburban areas).
This is the text of the Linn County Iowa air quality ordinances. It provides extensive language on control of air pollution sources through rules and permits.
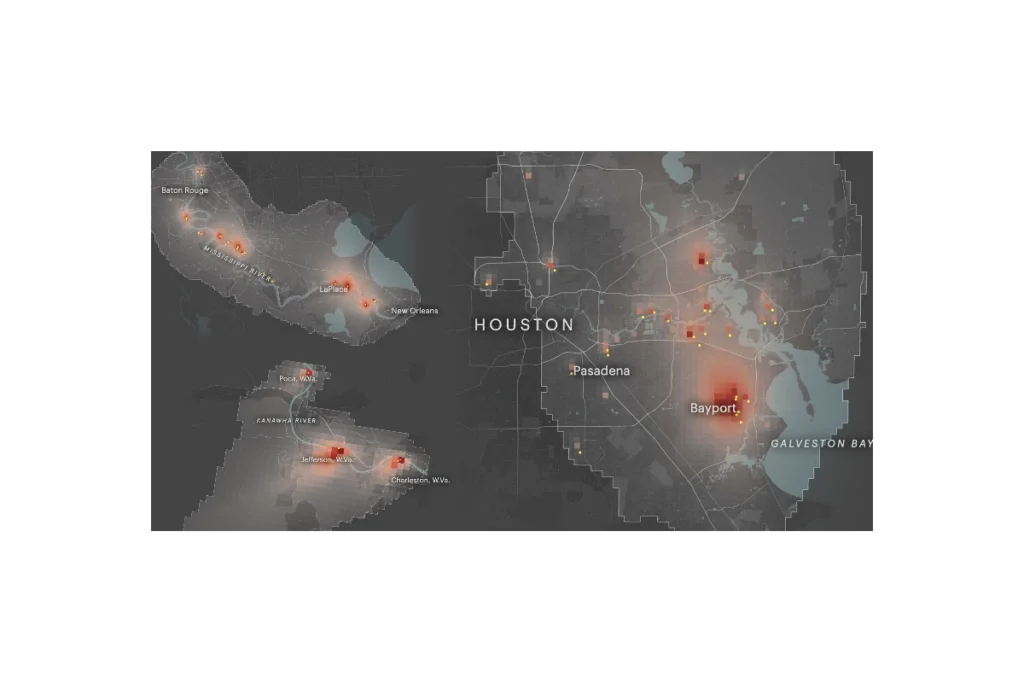
ProPublica’s Toxmap is an interactive map that visualizes estimated cancer risk from industrial air pollution across the United States. Built from EPA emissions and modeling data, it shows how toxic chemicals from thousands of facilities spread into surrounding neighborhoods, highlighting hotspots where cumulative industrial air pollution may raise cancer risk to levels the government considers unacceptable. The site lets users zoom to specific communities, see which facilities are driving risk, and explore patterns of environmental injustice in overburdened areas.
Subscribe
Sign up to get the latest updates on new city clean air tools and resources.