Website providing information on state, Tribal, and federal implementation plans. Information included on approved state regulations, source specific requirements, and nonregulatory provisions.
Website providing downloads of two databases: a control measures reference library which provides information on control technologies for a variety of source categories, and a menu of control measures which provides information on existing emission reduction measures including efficiency and cost-effectiveness for large point sources and some nonpoint sources.
Provides six case studies of strategies for air pollution management from cities around the world, including New York City, NY; Barranquilla, Columbia; Accra, Ghana; Kampala, Uganda; Jakarta, Indonesia; and Beijing, China. The New York case study focused on enhanced local air quality monitoring to address specific causes of local poor air quality.
Example of an ordinance regulating the construction and expansion of facilities that create air pollution. Provides information on the process, requirements and regulations, and zoning requirements.
This is the text of the Linn County Iowa air quality ordinances. It provides extensive language on control of air pollution sources through rules and permits.
Website providing access to tools and resources related to Best Available Control Technologies to reduce emissions of criteria pollutants and air toxics.
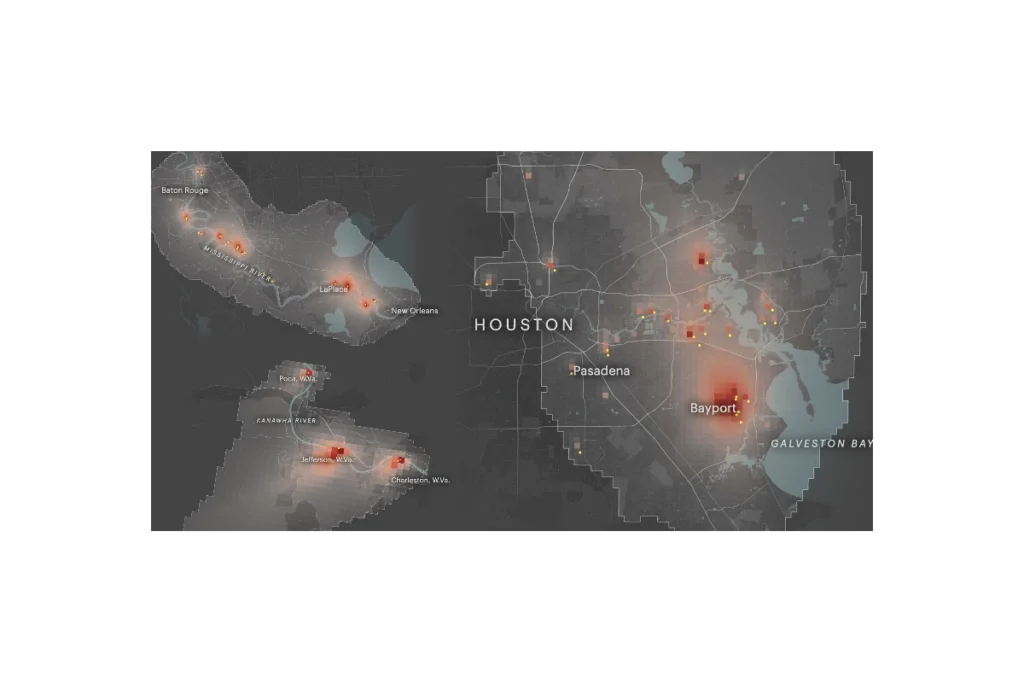
ProPublica’s Toxmap is an interactive map that visualizes estimated cancer risk from industrial air pollution across the United States. Built from EPA emissions and modeling data, it shows how toxic chemicals from thousands of facilities spread into surrounding neighborhoods, highlighting hotspots where cumulative industrial air pollution may raise cancer risk to levels the government considers unacceptable. The site lets users zoom to specific communities, see which facilities are driving risk, and explore patterns of environmental injustice in overburdened areas.
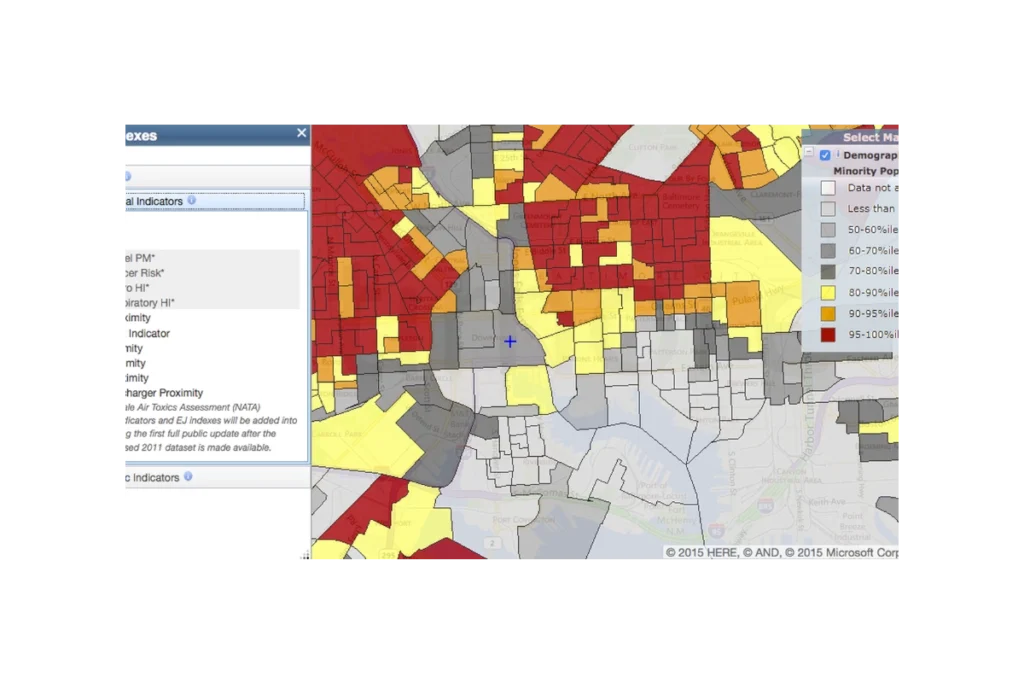
EJScreen (formerly an EPA tool, now discontinued and publicly hosted) is a national mapping and screening tool that combines environmental, health, and demographic data to help identify communities that may be disproportionately impacted by pollution and other environmental hazards. It provides interactive maps and summary reports for “EJ indexes” that blend measures like air pollution, proximity to industrial facilities, traffic, and waste sites with indicators such as income, race/ethnicity, and language isolation. Agencies, communities, and advocates use EJScreen to screen for potential environmental justice concerns, prioritize areas for further study or action, and support planning, permitting, and policy decisions.
Subscribe
Sign up to get the latest updates on new city clean air tools and resources.