Investigate the problem icon
Step 1: Investigate the problem

Map air quality in your city

Understanding when and where air pollution’s impacts are felt within your city, as well as which pollutants contribute most to poor air quality, allows you to better target interventions and maximize their impact.

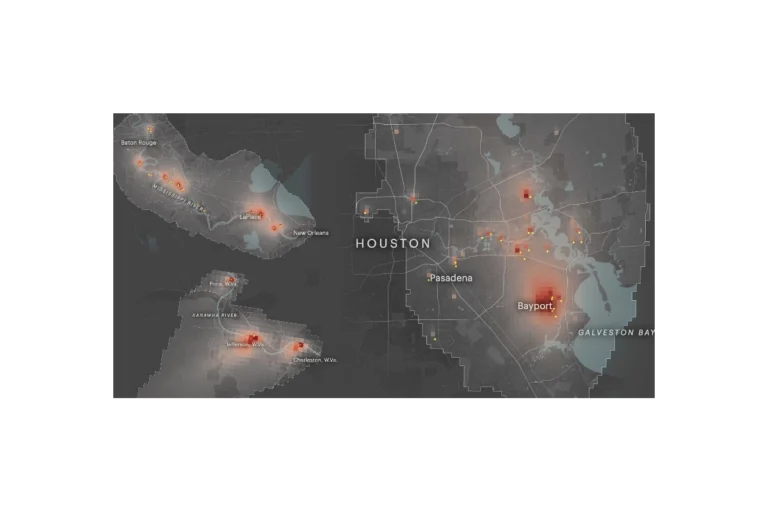
Air quality data is available from several sources, including regulatory monitors, low-cost air sensors, satellite retrievals and models. This section offers guidance and resources to help your city tap into locally-relevant air quality information that makes it easier to understand how air quality has changed over time and what it may look like in the future.

Air quality data

  • Filters

    Reset filters
  • Geographic Coverage

  • Sector

  • Pollutants

  • Resource Type

  • Format

  • Cost

  • Owner

  • Data Type

Database Map

New Jersey What’s In My Community?

Mapping tool that provides information on permitted facilities in New Jersey. The tool provides information on the reported emissions for each major and minor source, as...
Report

CITY OF CHICAGO Air Quality and Health Report

The Chicago Department of Public Health (CDPH) analyzed community-level data on air quality, health, and social factors to identify neighborhoods that should be prioritized for efforts...
Analysis Evaluation Map

Toxmap

ProPublica’s Toxmap is an interactive map that visualizes estimated cancer risk from industrial air pollution across the United States. Built from EPA emissions and modeling data,...
Database Strategy examples Tool

Air quality communications toolkit

The C40 Communication Toolkit for Air Quality is a product of the best practices shared and lessons learned by these cities and is designed to help...
Washington DC air pollution heatmap
Nitrogen dioxide pollution contributes to approximately 3,500 new childhood asthma cases every year in the Washington D.C. metro region.
New York City air pollution heatmap
Nitrogen dioxide pollution contributes to approximately 21,000 new childhood asthma cases every year in the New York metro region.
Philadelphia air pollution heatmap
Nitrogen dioxide pollution contributes to approximately 4,000 new childhood asthma cases every year in the Philadelphia metro region.
Chicago air pollution heatmap
Nitrogen dioxide pollution contributes to more than 10,000 new childhood asthma cases every year in the Chicago metro region.
Boston air pollution heatmap
Nitrogen dioxide pollution contributes to approximately 2,700 new childhood asthma cases every year in the Boston metro region.
Austin air pollution heatmap
Nitrogen dioxide pollution contributes to more than 1,800 new childhood asthma cases every year in the Austin metro region.
Baltimore air pollution heatmap
Nitrogen dioxide pollution contributes to more than 1,300 new childhood asthma cases every year in Baltimore metro region.

Sign up to get the latest updates on new city clean air tools and resources.