Case study of a partnership between Maryland Department of the Environment and Cheverly, Maryland to use data from a hyper-local air sensor network and local traffic data to target air emissions inspections.
The Climate and Health Program uses CDC's Evaluation Framework to monitor and evaluate the effectiveness of climate and health work. To highlight the evaluation planning process for climate and health, the program has translated the steps of the CDC Evaluation Framework into a video series. The videos showcase best practices evaluators can apply, as well as some common challenges, using real-world examples of today's most pressing climate threats, namely heat, flooding, and insect vectors.
"BetterHubs aims to use a set of core objectives to help governments, companies, investors, and local communities design and engage with Hub projects in a way that sets a new bar for industrial innovation."
Air sensor monitors that are lower in cost, portable and generally easier to operate than regulatory-grade monitors are widely used in the United States to understand air quality conditions. This website provides the latest science on the performance, operation and use of air sensor monitoring systems for technology developers, air quality managers, participatory scientists and the public. The EPA is involved in the advancement of air sensor technology, including performance evaluations of sensor devices and best practices for effectively using sensors. The information can help the public learn more about air quality in their communities.
"The National Environmental Public Health Tracking Network (Tracking Network) brings together health data and environmental data from national, state, and city sources and provides supporting information to make the data easier to understand. The Tracking Network has data and information on environments and hazards, health effects, and population health."
This report introduces the concept of Sustainable First Mover Initiatives (SFMIs)33333. These are $1.5^{\circ}C$ Paris Agreement-aligned efforts designed to transition the shipping sector away from fossil fuels toward electrofuels (such as e-hydrogen, e-ammonia, and e-methanol)44444. The resource focuses on the role of ports as critical hubs for this transition, especially in the Global South, ensuring that decarbonization provides social, economic, and environmental co-benefits to local communities555555555.
The air quality trends summaries are intended to reflect actual air quality and therefore include concentrations that may have been impacted by episodic events like wildfires and dust storms.
AirCompare maps provide information for counties that monitored outdoor air quality in the last five years and tailor that information for groups more likely to be affected by different levels of pollution.
A example of a logic model and blank logic model template provided by the US EPA used to provide the roadmap of a project. From the document: "Logic models are useful tools for defining the educational and environmental outputs and outcomes that are planned to accomplish the goals and objectives of the project. A logic model is a visual presentation of the relationships between your work and your desired results. It communicates the performance story of your project, focusing attention on the most important connections between your actions and the results. A logic model can serve as a basic road map for the project, explaining where you are and where you hope to end up."
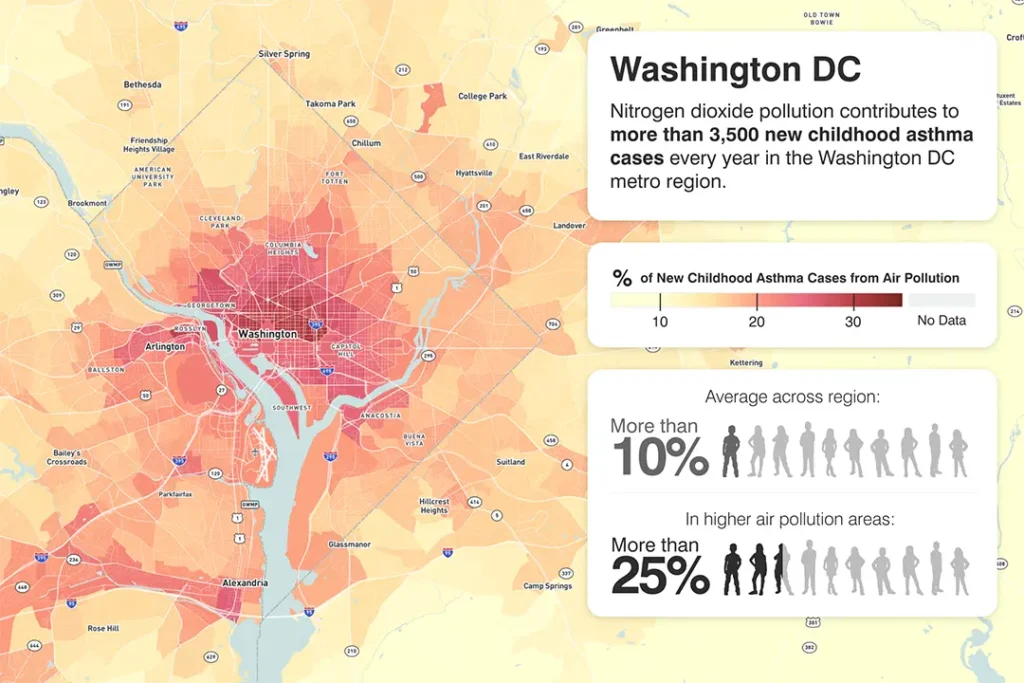
Nitrogen dioxide pollution contributes to approximately 3,500 new childhood asthma cases every year in the Washington D.C. metro region.
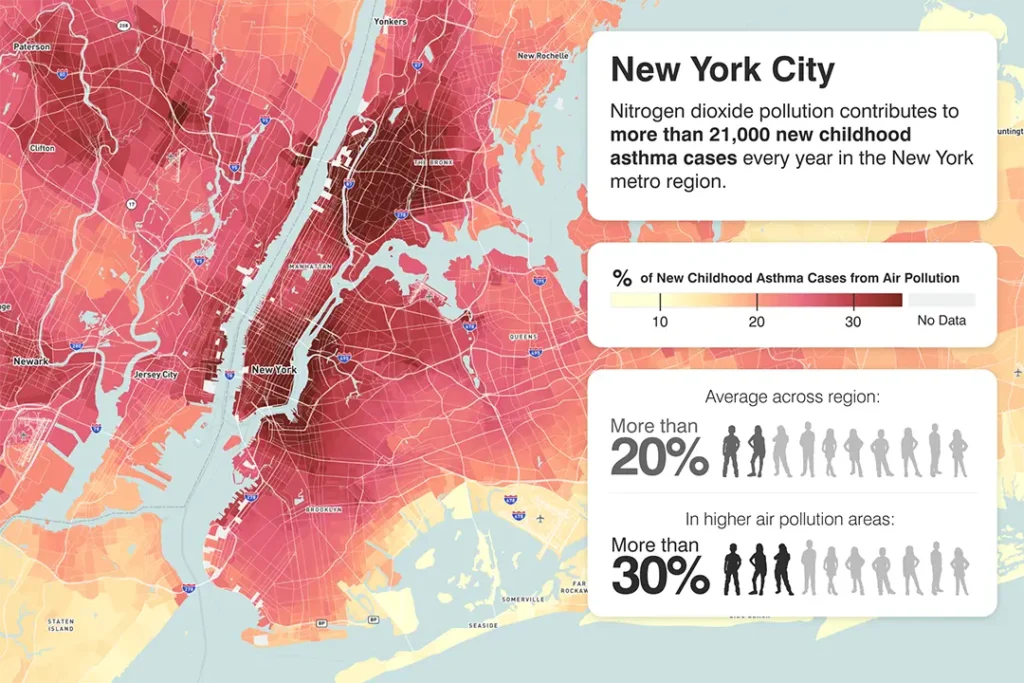
Nitrogen dioxide pollution contributes to approximately 21,000 new childhood asthma cases every year in the New York metro region.
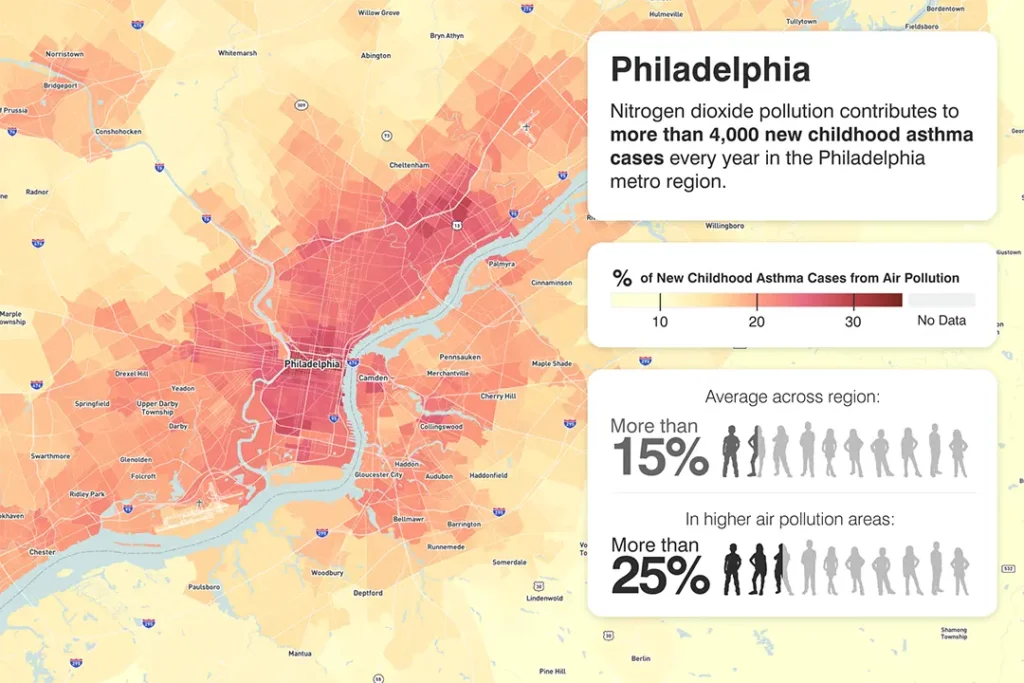
Nitrogen dioxide pollution contributes to approximately 4,000 new childhood asthma cases every year in the Philadelphia metro region.
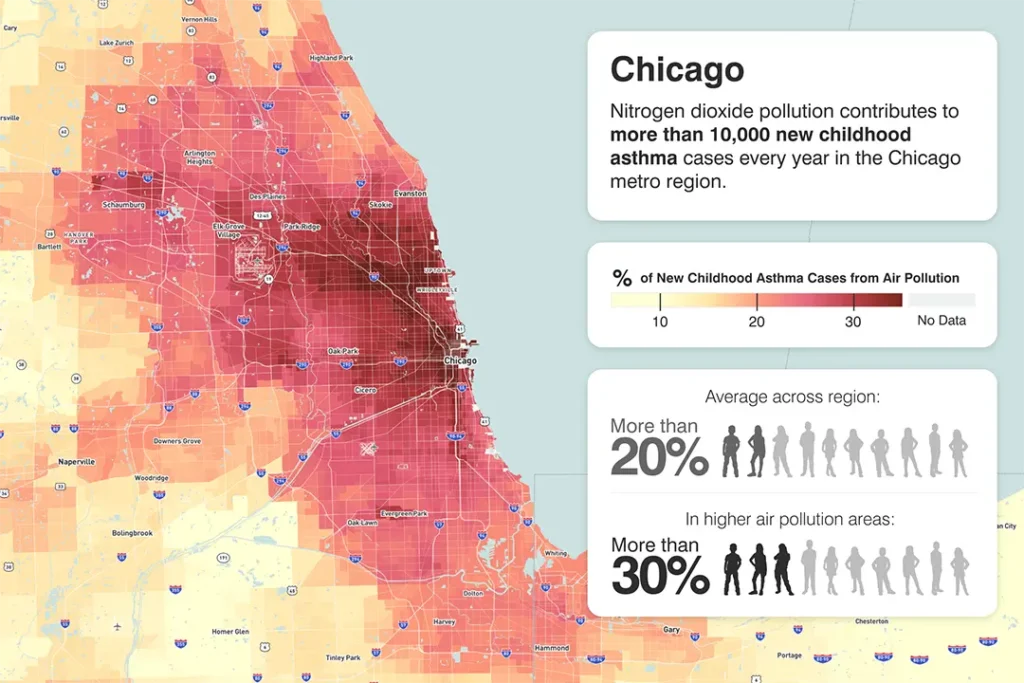
Nitrogen dioxide pollution contributes to more than 10,000 new childhood asthma cases every year in the Chicago metro region.
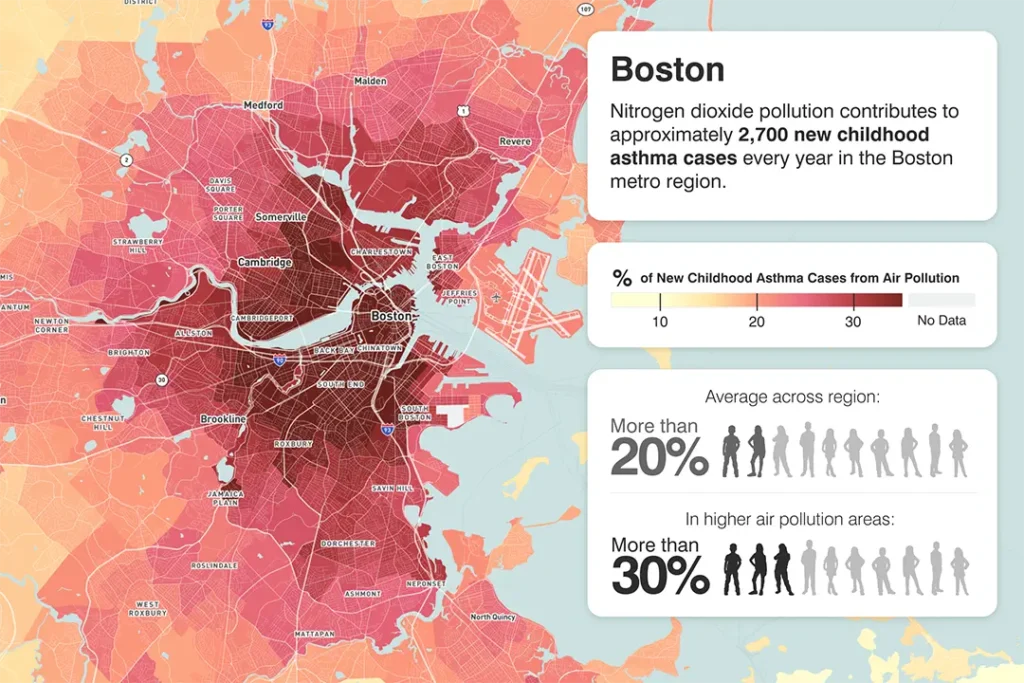
Nitrogen dioxide pollution contributes to approximately 2,700 new childhood asthma cases every year in the Boston metro region.
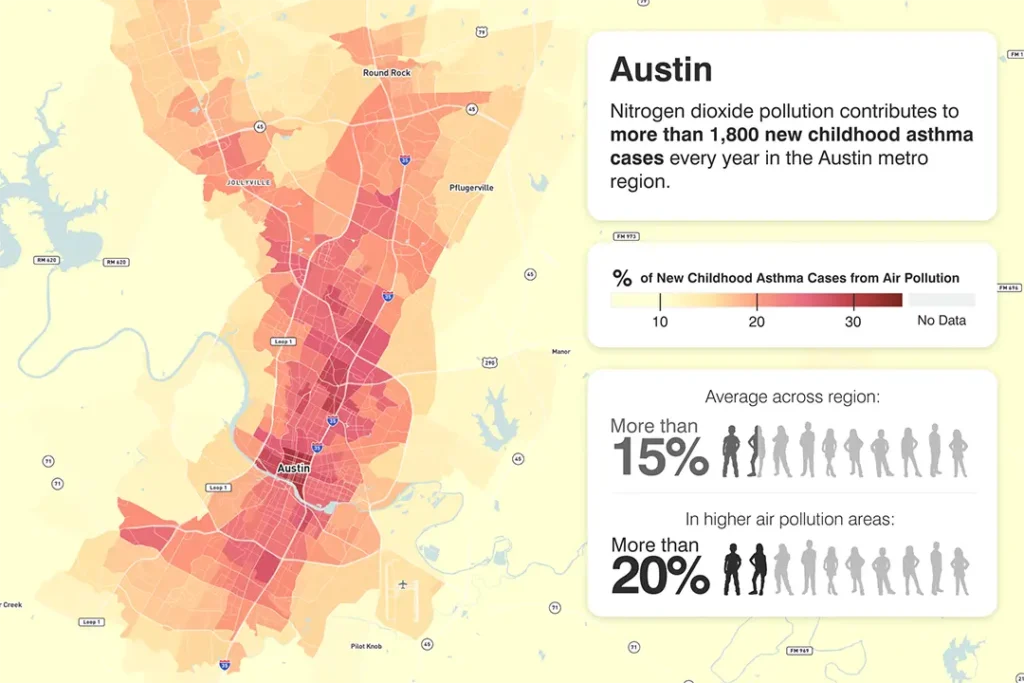
Nitrogen dioxide pollution contributes to more than 1,800 new childhood asthma cases every year in the Austin metro region.
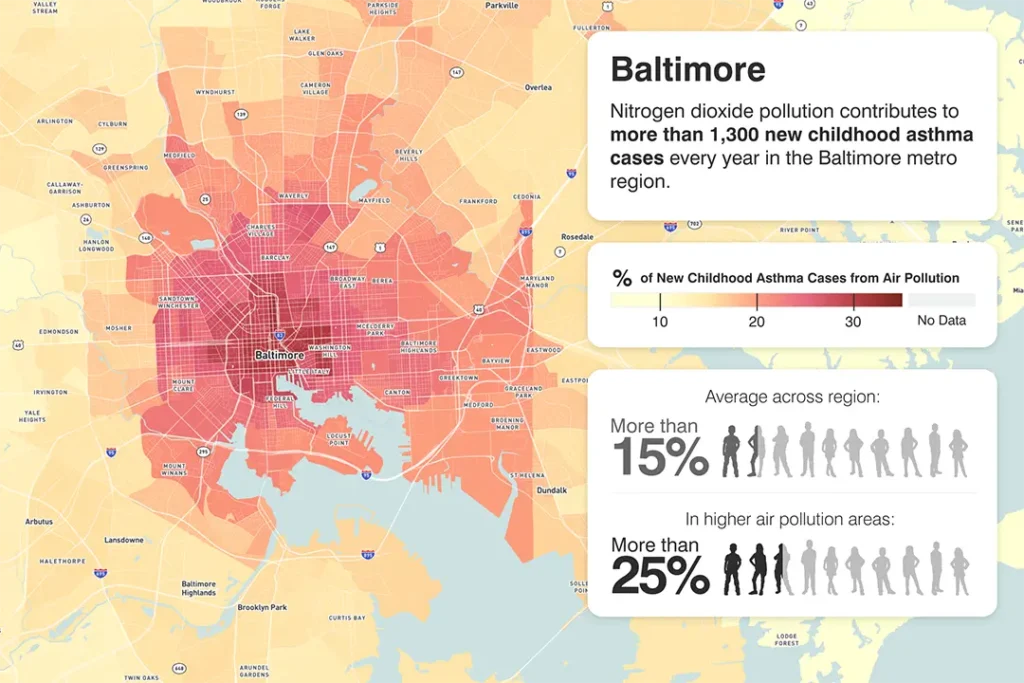
Nitrogen dioxide pollution contributes to more than 1,300 new childhood asthma cases every year in Baltimore metro region.
Subscribe
Sign up to get the latest updates on new city clean air tools and resources.