Air quality maps, trends viewer, a downloadable tool and lab data. From the website: "AQview is a community-focused air quality data portal bringing together government and community-led air monitoring data to a single platform. Our primary goal is make it easier to access, understand, and use air quality data collected from the wide range of monitoring efforts occurring across California."
SMOKE is primarily an emissions processing system designed to create gridded, speciated, hourly emissions for input into a variety of air quality models such as CMAQ, REMSAD, CAMX and UAM. SMOKE supports area, biogenic, mobile (both onroad and nonroad), and point source emissions processing for criteria, particulate, and toxic pollutants. For biogenic emissions modeling, SMOKE uses the Biogenic Emission Inventory System. SMOKE is also integrated with the on-road emissions model MOVES.
The AQUA tool is an easy-to-use excel spreadsheet model that city staff can use with minimal guidance. It uses population, exposure, health and economic cost data, as well as epidemiologic evidence to help users calculate how emission changes can benefit local air quality and health.
Atmospheric Composition Analysis Group applies satellite observations, global models, and in situ measurements to improve understanding about the processes controlling air quality, climate, and biogeochemical cycling
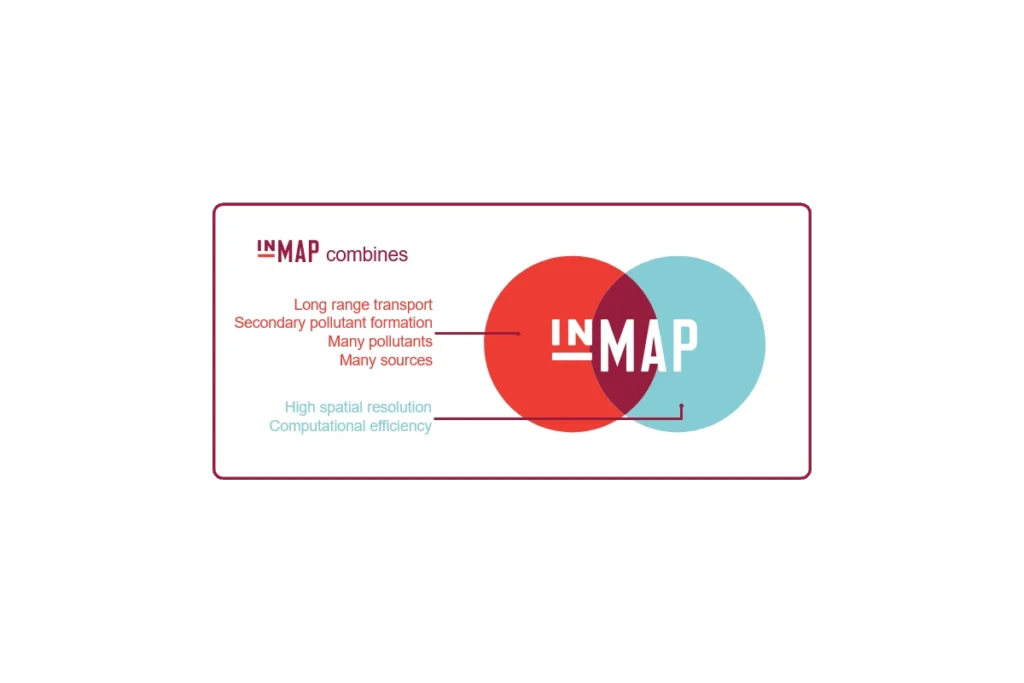
InMAP is a recently developed model which offers a new approach to estimating the human health impacts caused by air pollutant emissions and how those impacts are distributed among different groups of people.
"BetterHubs aims to use a set of core objectives to help governments, companies, investors, and local communities design and engage with Hub projects in a way that sets a new bar for industrial innovation."
Air sensor monitors that are lower in cost, portable and generally easier to operate than regulatory-grade monitors are widely used in the United States to understand air quality conditions. This website provides the latest science on the performance, operation and use of air sensor monitoring systems for technology developers, air quality managers, participatory scientists and the public. The EPA is involved in the advancement of air sensor technology, including performance evaluations of sensor devices and best practices for effectively using sensors. The information can help the public learn more about air quality in their communities.
This is a collection of air pollution control technology fact sheets, technical bulletins, and a limited number of software tools. The reports and fact sheets were mostly developed in the 1990's and early 2000's. They cover a wide range of sources and pollutants.
"The National Environmental Public Health Tracking Network (Tracking Network) brings together health data and environmental data from national, state, and city sources and provides supporting information to make the data easier to understand. The Tracking Network has data and information on environments and hazards, health effects, and population health."
Subscribe
Sign up to get the latest updates on new city clean air tools and resources.