AP-42, Compilation of Air Pollutant Emissions Factors from Stationary Sources, has been published since 1972 as the primary compilation of EPA's emissions factor information. It contains emissions factors and process information for more than 200 air pollution source categories. A source category is a specific industry sector or group of similar emitting sources. The emissions factors have been developed and compiled from source test data, material balance studies, and engineering estimates. The latest emissions factors are available below on this website. Use the AP-42 Chapter webpage links below to access the document by chapter. Emission factors are being updated as data are received and evaluated.
SPECIATE is the U.S. Environmental Protection Agency’s (EPA) database of organic gas and particulate matter (PM) speciation profiles of air pollution sources, which provide the chemical composition of emissions from sources as a percentage of the total weight of PM or organic gas. Organic gas profiles may represent total organic gases (TOG), volatile organic compounds (VOC) or a variation. PM speciation profiles include data for PM of various size classes, such as PM2.5, which represents the mass of particles less than
or equal to 2.5 microns in diameter. In addition to PM and organic gas profiles, SPECIATE contains other profiles such as for nitrogen oxides, mercury and semi-volatile organic compounds (SVOC).
The resource includes an online browser which allows users to view detailed information about the emissions profile in tabular form or bar and pie charts, as well as downloadable databases.
Mapping tool that provides information on permitted facilities in New Jersey. The tool provides information on the reported emissions for each major and minor source, as well as current information on PM and ozone monitored air quality, and community vulnerability information.
Provides guidance for emissions estimation and downloadable spreadsheet based tools for estimating emissions from several different source categories including asphalt plants, concrete plants, combustion sources, and woodworking facilities.
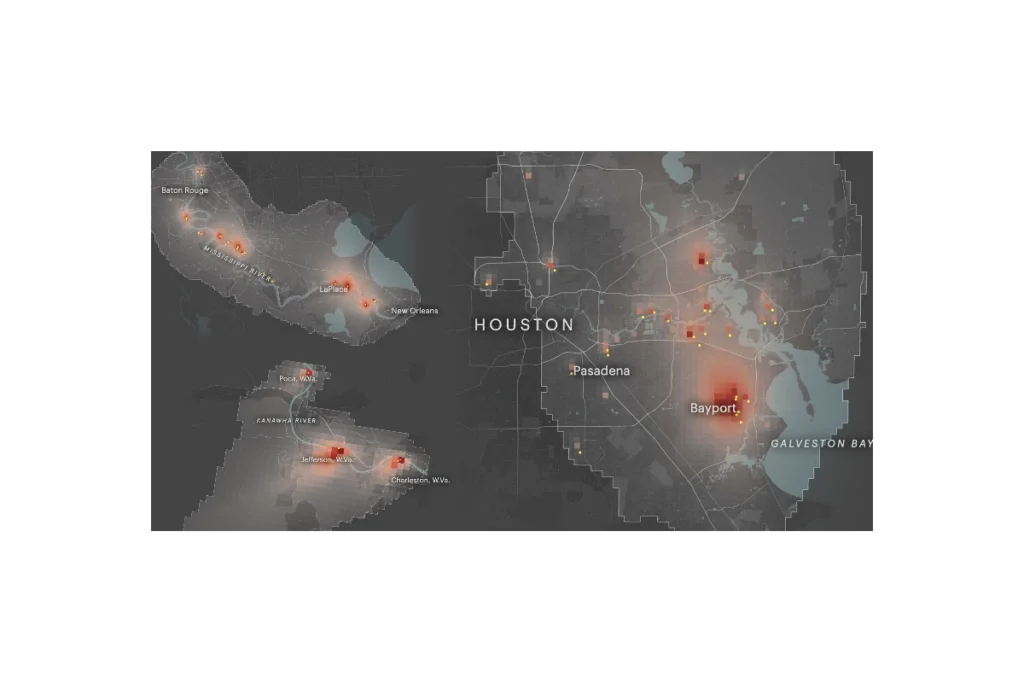
ProPublica’s Toxmap is an interactive map that visualizes estimated cancer risk from industrial air pollution across the United States. Built from EPA emissions and modeling data, it shows how toxic chemicals from thousands of facilities spread into surrounding neighborhoods, highlighting hotspots where cumulative industrial air pollution may raise cancer risk to levels the government considers unacceptable. The site lets users zoom to specific communities, see which facilities are driving risk, and explore patterns of environmental injustice in overburdened areas.
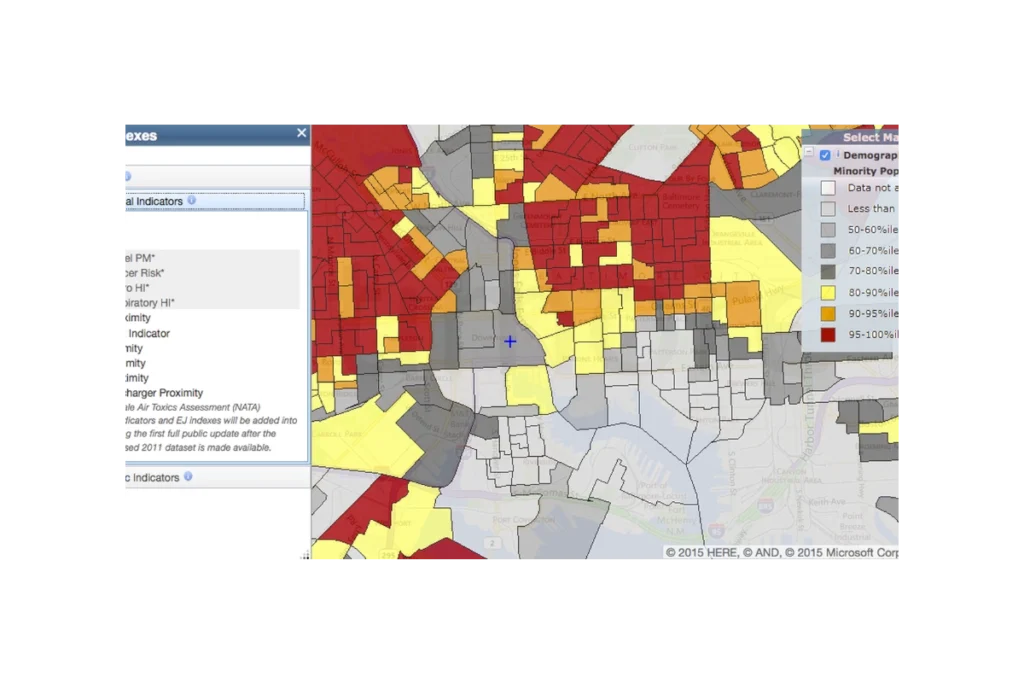
EJScreen (formerly an EPA tool, now discontinued and publicly hosted) is a national mapping and screening tool that combines environmental, health, and demographic data to help identify communities that may be disproportionately impacted by pollution and other environmental hazards. It provides interactive maps and summary reports for “EJ indexes” that blend measures like air pollution, proximity to industrial facilities, traffic, and waste sites with indicators such as income, race/ethnicity, and language isolation. Agencies, communities, and advocates use EJScreen to screen for potential environmental justice concerns, prioritize areas for further study or action, and support planning, permitting, and policy decisions.
The Chicago Department of Public Health’s Cumulative Impact Assessment is a citywide initiative to measure how multiple environmental burdens and social stressors combine to affect health across Chicago neighborhoods. Co-designed with community organizations through an Environmental Equity Working Group, the assessment compiles data on pollution sources, health outcomes, and vulnerability factors to identify communities facing the greatest cumulative impacts. Its findings and recommendations are intended to guide policies on land use, zoning, permitting, enforcement, transportation planning, and other decisions, and it serves as a foundation for Chicago’s broader Environmental Justice Action Plan and proposed cumulative impacts ordinance.
Subscribe
Sign up to get the latest updates on new city clean air tools and resources.