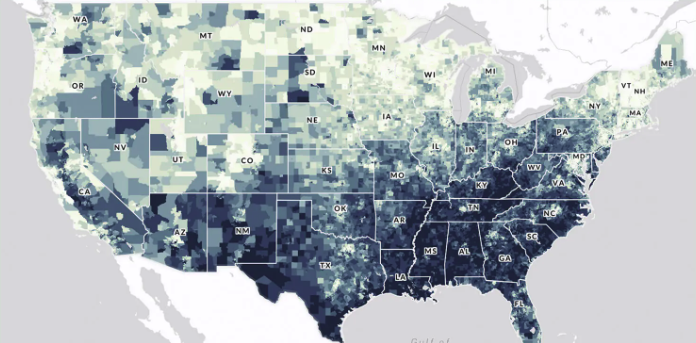
The U.S. Climate Vulnerability Index map is an interactive tool that ranks more than 70,000 U.S. census tracts using 184 indicators to show which communities face the greatest challenges from climate change. It visualizes “overall climate vulnerability” as well as underlying drivers in domains such as health, social and economic conditions, environment, infrastructure, and climate impacts (e.g., extreme events and climate disaster costs). Users can search for any location, compare tracts within a state or EPA region, and drill down to see which specific factors—like housing quality, exposure to pollution, or health burdens—are contributing to vulnerability, helping communities and decision‑makers target climate resilience investments where they are needed most.
This page provides resources for measuring transportation greenhouse gas emissions and air quality impacts, and incorporating climate adaptation and resilience features as they relate to a proposed project.
High-resolution, map-based decision-support tool launched in Fall 2023. It was co-developed by the non-profit American Forests alongside a council of local stakeholders, including city governments, state agencies, and community advocates.
This is a comprehensive tool that allows users to query, locate, and view GHG, criteria, and air toxics emissions. The tool includes maps, charts, and tables, and allows for visualization of trends over time. The tool allows users to display community vulnerability data. Maps and data are downloadable.
Founded in 2018, through the Bloomberg Mayors Challenge, the city of Denver created Love My Air. Love My Air is a citywide monitoring network to provide real-time air quality data utilizing cutting-edge air pollution technology. Through collaboration with many community organizations and partners, Love My Air provides workshops, trainings, and outreach connecting health to air quality.
Mapping tool that provides access to a wide array of information related to air quality management, including permits, air quality monitoring, community vulnerability, public engagement, and enforcement actions.
This open collection is designed to support and enhance global research initiatives focused on understanding and mitigating the health impacts of environmental exposures.
Subscribe
Sign up to get the latest updates on new city clean air tools and resources.