A compendEnviroAtlas is a comprehensive geospatial decision-support tool developed by the EPA to help users visualize and analyze the relationships between nature, people, and health.
The Air Pollution Emission Experiments and Policy analysis (APEEP) model is an integrated assessment model that links emissions of air pollution to exposures, physical effects, and monetary damages in the contiguous United States.
The air quality trends summaries are intended to reflect actual air quality and therefore include concentrations that may have been impacted by episodic events like wildfires and dust storms.
AirCompare maps provide information for counties that monitored outdoor air quality in the last five years and tailor that information for groups more likely to be affected by different levels of pollution.
This open collection is designed to support and enhance global research initiatives focused on understanding and mitigating the health impacts of environmental exposures.
SPECIATE is the U.S. Environmental Protection Agency’s (EPA) database of organic gas and particulate matter (PM) speciation profiles of air pollution sources, which provide the chemical composition of emissions from sources as a percentage of the total weight of PM or organic gas. Organic gas profiles may represent total organic gases (TOG), volatile organic compounds (VOC) or a variation. PM speciation profiles include data for PM of various size classes, such as PM2.5, which represents the mass of particles less than
or equal to 2.5 microns in diameter. In addition to PM and organic gas profiles, SPECIATE contains other profiles such as for nitrogen oxides, mercury and semi-volatile organic compounds (SVOC).
The resource includes an online browser which allows users to view detailed information about the emissions profile in tabular form or bar and pie charts, as well as downloadable databases.
USALEEP (U.S. Small-Area Life Expectancy Estimates Project) provides census-tract–level estimates of life expectancy at birth for nearly all neighborhoods in the United States. Developed by CDC’s National Center for Health Statistics with partners, it uses death records and population data to show how long people are expected to live, on average, in small geographic areas. These data help researchers, health departments, and communities identify and address stark local differences in longevity linked to social, economic, and environmental conditions.
A example of a logic model and blank logic model template provided by the US EPA used to provide the roadmap of a project. From the document: "Logic models are useful tools for defining the educational and environmental outputs and outcomes that are planned to accomplish the goals and objectives of the project. A logic model is a visual presentation of the relationships between your work and your desired results. It communicates the performance story of your project, focusing attention on the most important connections between your actions and the results. A logic model can serve as a basic road map for the project, explaining where you are and where you hope to end up."
This site hosts an interactive R Shiny application that explores the relationship between asthma and nitrogen oxides (NOx) pollution. Users can view and interact with charts or maps to see how asthma outcomes vary with NOx levels across locations or over time, making it easier to visualize potential links between traffic‑related air pollution and respiratory health.
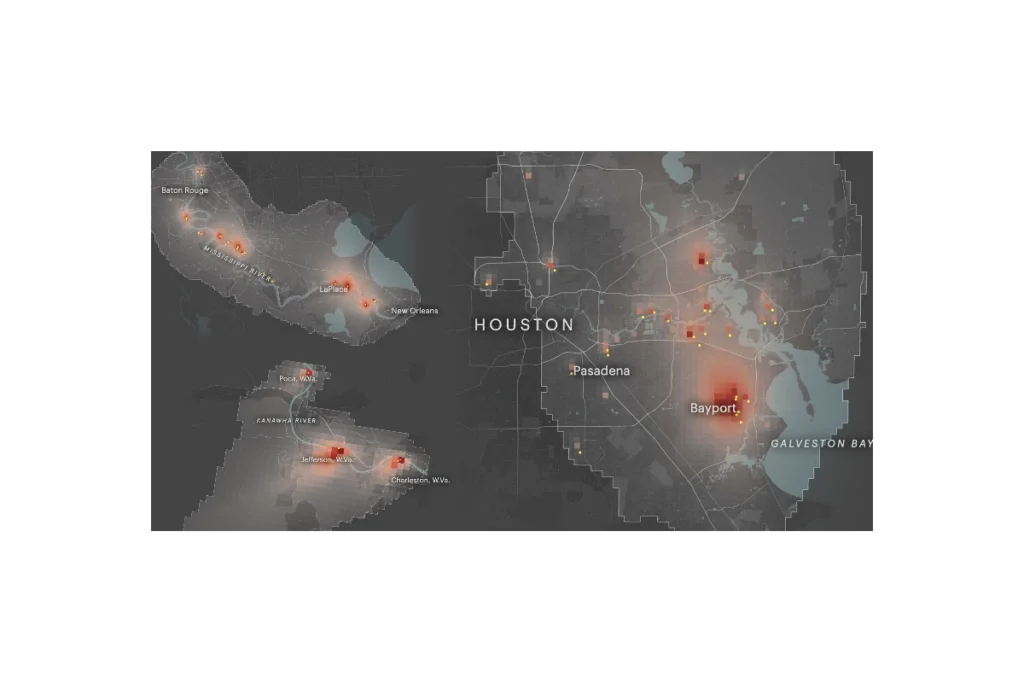
ProPublica’s Toxmap is an interactive map that visualizes estimated cancer risk from industrial air pollution across the United States. Built from EPA emissions and modeling data, it shows how toxic chemicals from thousands of facilities spread into surrounding neighborhoods, highlighting hotspots where cumulative industrial air pollution may raise cancer risk to levels the government considers unacceptable. The site lets users zoom to specific communities, see which facilities are driving risk, and explore patterns of environmental injustice in overburdened areas.
Subscribe
Sign up to get the latest updates on new city clean air tools and resources.