The Climate and Health Program uses CDC's Evaluation Framework to monitor and evaluate the effectiveness of climate and health work. To highlight the evaluation planning process for climate and health, the program has translated the steps of the CDC Evaluation Framework into a video series. The videos showcase best practices evaluators can apply, as well as some common challenges, using real-world examples of today's most pressing climate threats, namely heat, flooding, and insect vectors.
The AQUA tool is an easy-to-use excel spreadsheet model that city staff can use with minimal guidance. It uses population, exposure, health and economic cost data, as well as epidemiologic evidence to help users calculate how emission changes can benefit local air quality and health.
This page provides resources for measuring transportation greenhouse gas emissions and air quality impacts, and incorporating climate adaptation and resilience features as they relate to a proposed project.
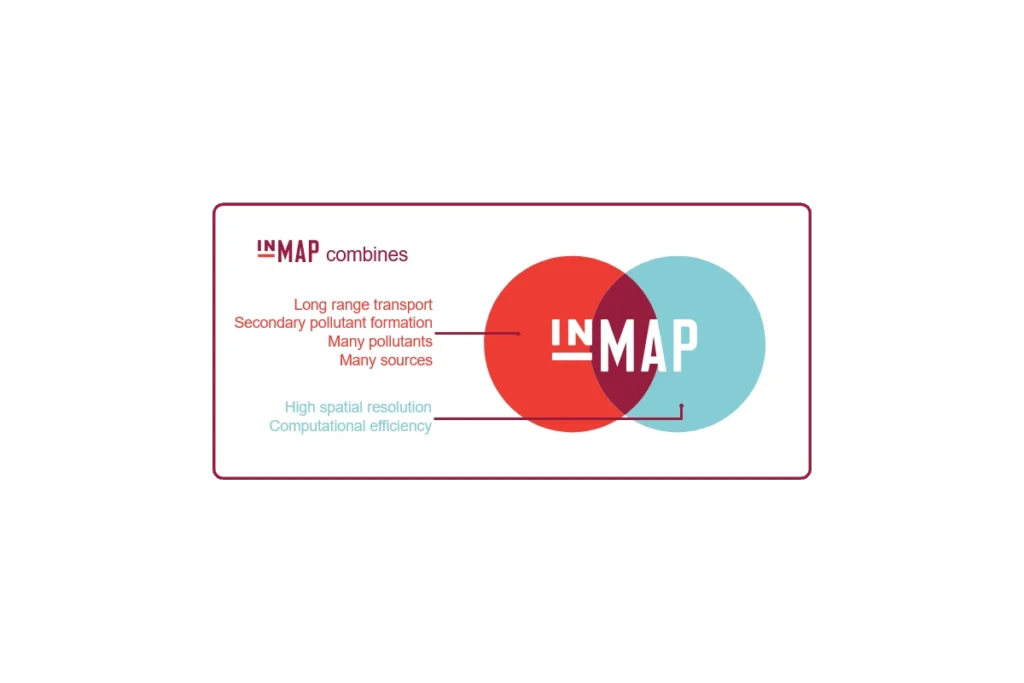
InMAP is a recently developed model which offers a new approach to estimating the human health impacts caused by air pollutant emissions and how those impacts are distributed among different groups of people.
"The National Environmental Public Health Tracking Network (Tracking Network) brings together health data and environmental data from national, state, and city sources and provides supporting information to make the data easier to understand. The Tracking Network has data and information on environments and hazards, health effects, and population health."
Case study of a potential program to reduce emissions from medium and heavy duty vehicles in Chicago. Includes modeling of emissions reductions for NOx and GHG, air quality impacts for NO2, ozone, and PM2.5, and estimates of health benefits.
The Air Quality Life Index (AQLI) converts air pollution concentrations into their impact on life expectancy. Through the AQLI’s hyper-local data, users anywhere on Earth can zoom into their district and see how much longer they would live if policies were to reduce pollution to meet the World Health Organization’s guideline, a national standard, or a user-defined target. This information can help inform local communities and policymakers about the benefits of air pollution policies in perhaps the most important measure that exists: longer lives.